


Anton Agafonov, Daria Ksenofontova, Karl Shkhinek «Coastal Ice Investigation on the Site of Further Bridge Construction. Sveagruva, Svalbard, Norway»
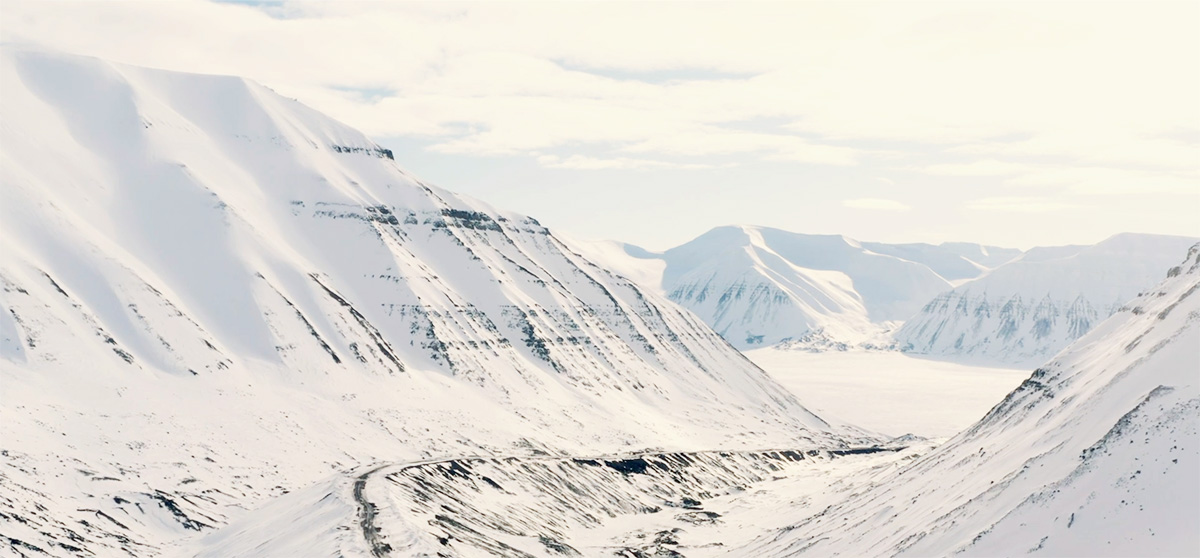
Sveagruva is a mining settlement in the Norwegian archipelago of Svalbard, lying in the head of Van Mijenfjord. A bridge to the opposite site of the fjord is planned to be constructed for further mine development, so investigations of coastal ice forces on one of the future bridge suspensions were held.
Introduction
Sveagruva settlement is located in one of the northern archipelagos on the latitude of almost 78°, therefore ice loads become significant during construction and maintenance of offshore and costal structures [1,2,3]. Moreover, Arctic sea coasts and a bottom of adjacent shallow water areas can be characterized by a specific frozen stratum that provides quite a challenge for future bridge erecting [4,5].
The bridge is going to lay across the strait Sveasundet and connect capes Barryneset and Littrowneset. The site of investigation was near Fabrice Cabine, on the cape Barryneset (shown on the Fig. 1).
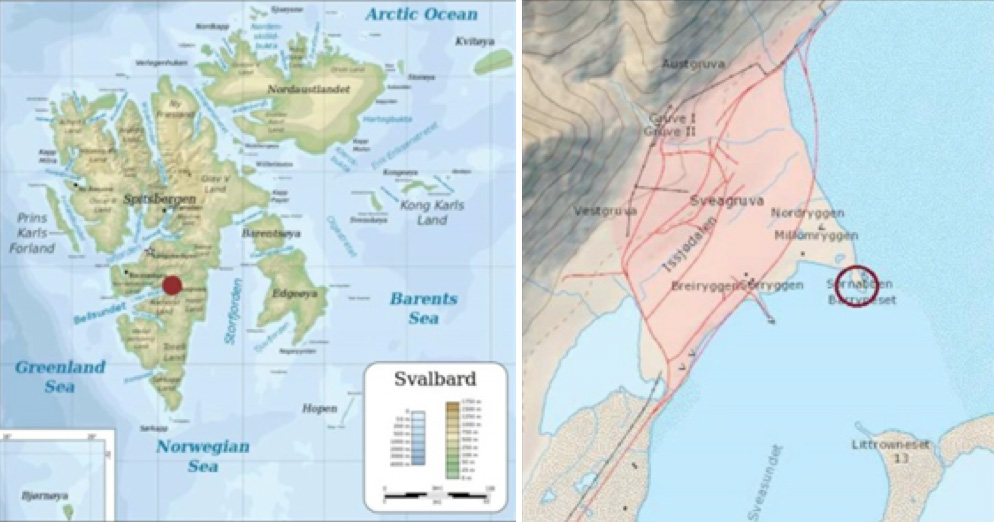
Figure 1. Site of investigation, market with red
Profiling of the hinge-zone
Theory. Ice conditions in the Barents sea were investigated and discussed in many papers [3,6], but for Sveagruva region they might be more severe due to complicated size of the fjord, closeness of Paulabreen glacier with extended fresh water extent in a result, and effect of coastal line.
Between a grounded ice sheet and a floating ice shelf there is a hinge zone that is neither fully one nor the other. Whereas the grounded ice sheet is supported by its bed and is unaffected by sea tides, the ice shelf is floating and in constant motion following the sea tide. The ice within the hinge zone is supported partly by the hydrostatic pressure from the sea beneath and partly by internal stresses. The sea bed topography and the ability of the ice to support stresses over periods of the tidal cycle governs the extent and nature of the hinge zone [7,8].
Experimental set-up. To make the profiles 17 holes were drilled by a 2" drill on a straight line from the cabin to the direction of Littrowneset. Distance between the holes was measured by a tape ruler, thickness of ice and snow – by a measuring stick. After drilling, water level for each hole was estimated at 10:00 and 17:00. This is approximately the time of low and high tide at this site during the days of investigation.
A week before one more profile was made in a slight other direction from the cabin and the ice thicknesses of those two were dramatically different. To obtain the spot where ice thickness changed on the way from one cross-section to the other one more profile was made (time – 19:00).
Also the positions of tidal cracks were mapped. The plan of the profiles and cracks is presented on the Figure 2. As the picture was taken in 2008, some changes have occurred to the shore line: due to the coastal erosion, bluff is now is on the line painted by red color. Also the cabin was replaced on another place (marked by red rectangular).
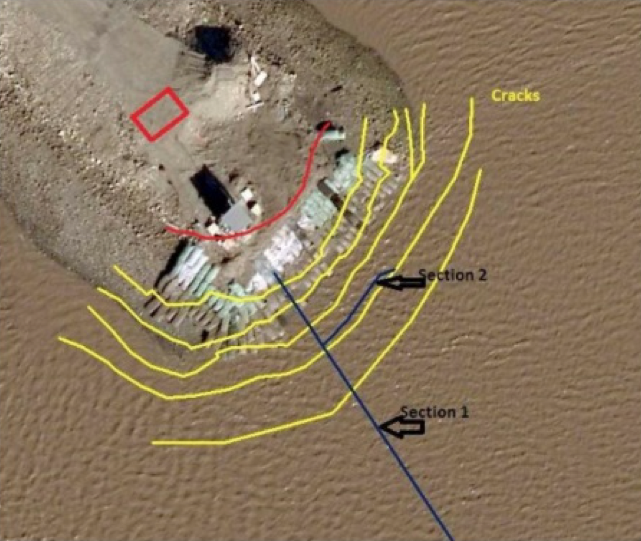
Figure 2. The position of the profiles and tidal cracks
Results. While making the profile several things were assumed and several simplifications were made:
− the tidal difference is assumed to be 1,3 meters [9];
− the vertical distance from high tide water level to the coastal bluff is 0.5 meters;
− at high tide the ice was grounded at 3m, and at low tide at 8 meters from the first recording (7 and 12 meters from the bluff);
− the bottom topography is sometimes not correct, there were not enough measurements.
On the Fig. 3 and Fig. 4 two profiles are presented:
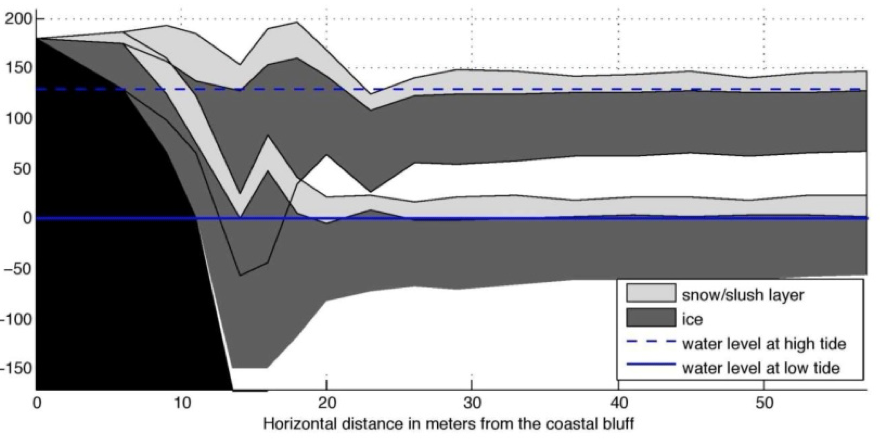
Figure 3. Profile showing the hinge-zone at high and low tide
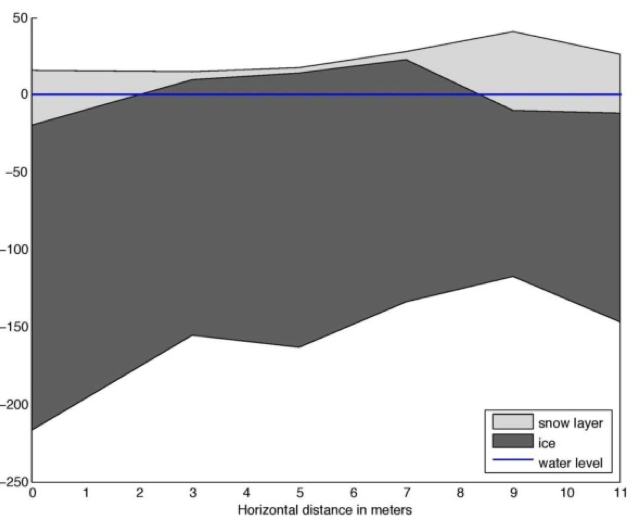
Figure 4. Orthogonal profile
Discussion. From the first cross section one can see that the hinge-zone end in approximately 30 meters from the coastal bluff where ice becomes relatively flat. On the spot of 23 meters from the bluff there is a local depression, reason of each could be bending of the ice because of friction forces between ice field and ground near the coastal line from the one side and forces that pull the ice to the shore. But it also could be a mistake of measuring a free board, because there was a lot of slush in that place which could easily transfer water upwards and cause incorrect measurements.
It was determined that approximately 7m of ice sheet was grounded in high tide and 11 at low tide. That cyclical movement could create large stresses on inclined coastal bluff, that were discussed before, for example [10,11,12].
From the Fig. 4 dramatically changes in the ice thickness along the shore can be seen. That could be because of specificity of the coastal line or because differences in tidal action in two sides of the peninsula: Braganzavagen and Sveabukta.
Stresses in the ice
Theory. A datalogger, Geokon RS LC-2, with four channels, records pressure and sensor temperature, as well as its own internal temperature, time and battery voltage. Each channel has a sensor connected [13]
To measure the stresses in the ice Geokon VW Earth Pressure Cell, model 4800 was used. The sensor consists of two circular metal plates which are welded together in their periphery. The narrow space between the plates is filled with deaired oil. When the ice pressure increases the metal plates will be pushed together and the oil pressure inside the narrow spacing will increase. The oil pressure is converted into an electrical signal by a vibrating wire pressure transducer. The electrical signal is then transmitted to the datalogger.
The pressure cell consists of the circular welded plates at the bottom and the cylindrical box further up that is the transducer housing. Located inside the vibrating wire pressure transducer housing is a thermistor for the measurement of temperature at the cell location. The thermistor gives a varying resistance output as the temperature changes. This thermistor resistance is converted to temperature [14].
Experimental Setup. Stresses in the ice were measured in two places: «site 1» was outside the last tidal crack and "site 2" was 200m father to the south from the peninsula. In each site there were four sensors. Three of the sensors were frozen into the ice adjacent to the datalogger, positioned at an angle of 120° to one another, see Fig. 5.
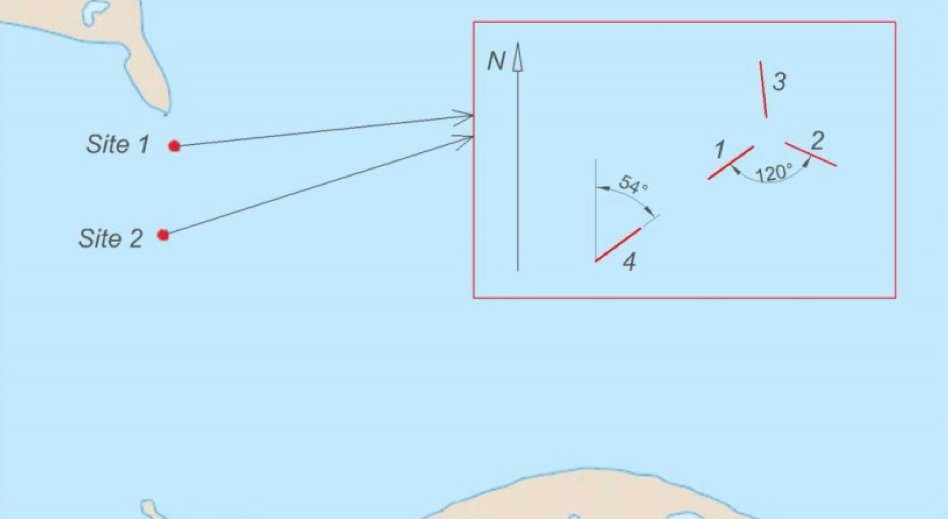
Figure 5. The position of stress sensors
The sensors were installed with the flat surface vertical to measure horizontal stresses. This angle was chosen to measure the forces in an even distributed direction. The fourth sensor was drilled into the ice alone; this was intended to act as a control sensor, also it was drilled not so deep as other sensors. Site one sensors were installed on different sides of a tidal crack, as stresses were expected to be dramatically different [15].
The data used for analyzing was recorded from 30-March-2014 19:00 to 2-April-2014 10:50. Also the tidal pressure measurements for the same period were recorded. Both the data from the datalogger as well as the tidal pressure data was analyzed using Matlab. Calculation of stresses in the ice was discussed in several papers before [16,17,18,19,20,21,22], we have used the most appropriate formulas for existing conditions.
Resuts. The results from the pressure sensors at Fabrice cabin are shown in Fig. 6, 7. Each figure includes a tidal pressure plot and an ice temperature plot below for the same period of time. Fig. 8, 9 show the principal stresses for each site, and angle between the major stress and the north direction.
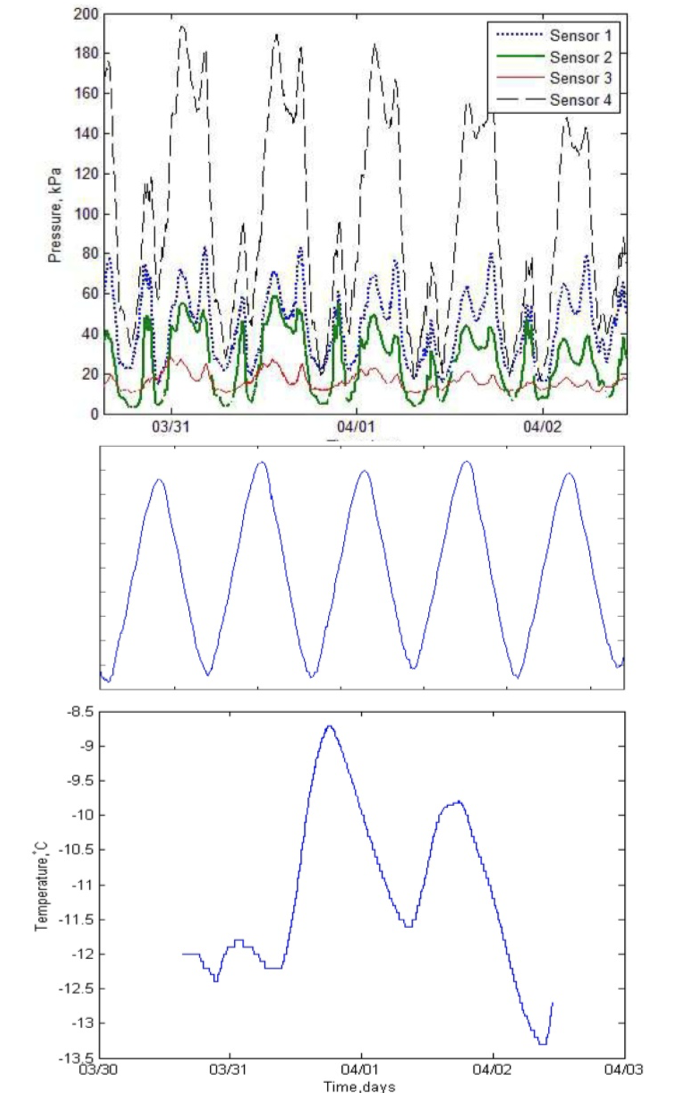
Figure 6. Measurements from the stress sensors with corresponding tidal action and temperature (Site 1)
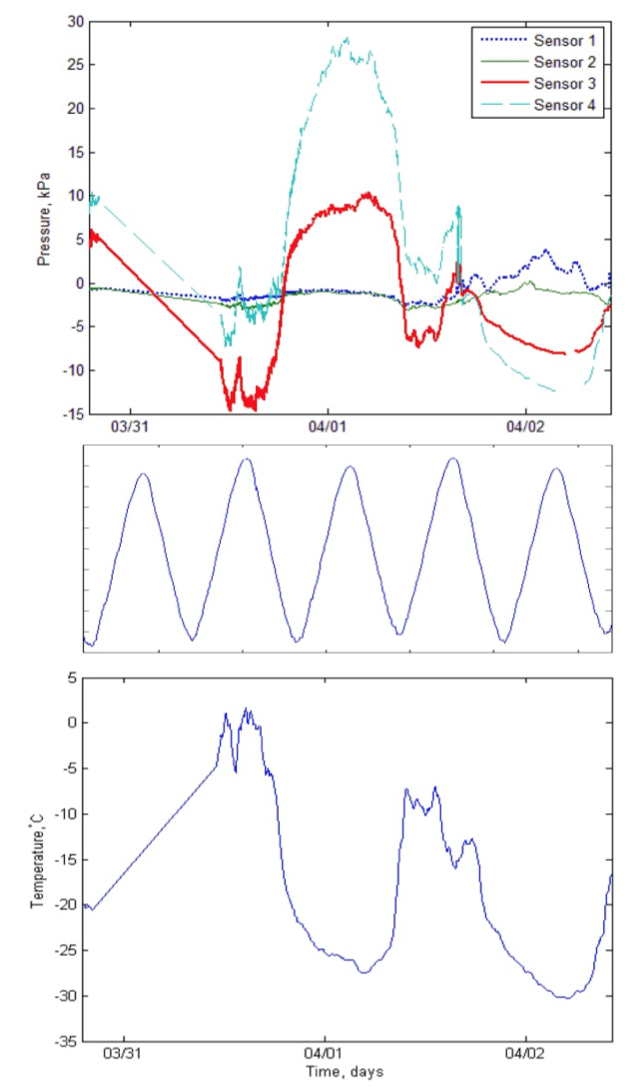
Figure 7. Measurements from the stress sensors with corresponding tidal action and temperature (Site 2)
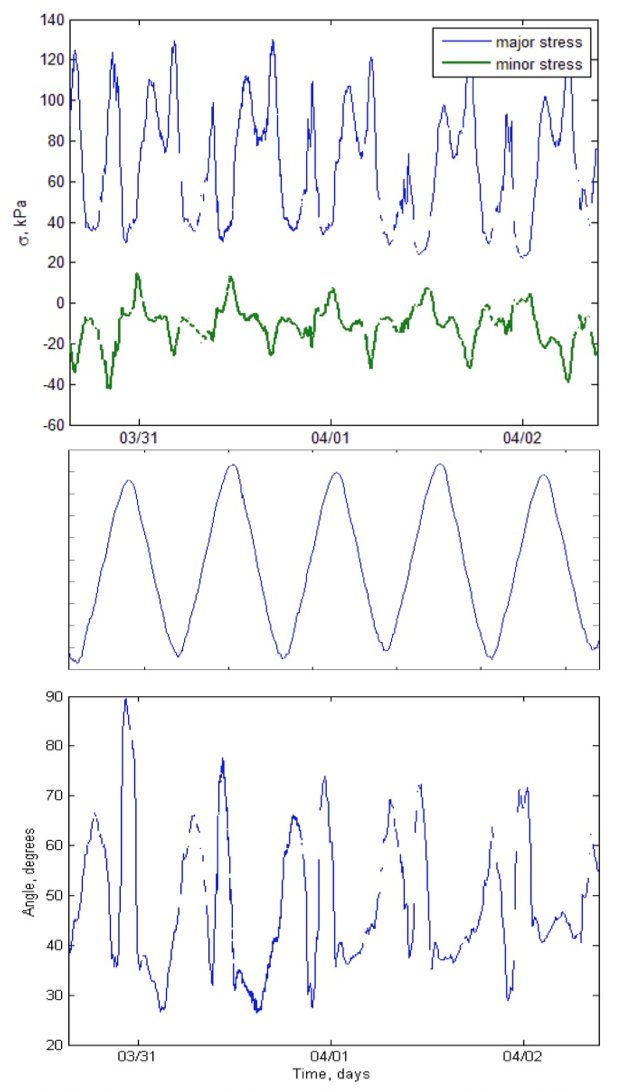
Figure 8. Principal stresses, angle between the major stress and the north direction and corresponding tide (Site 1)
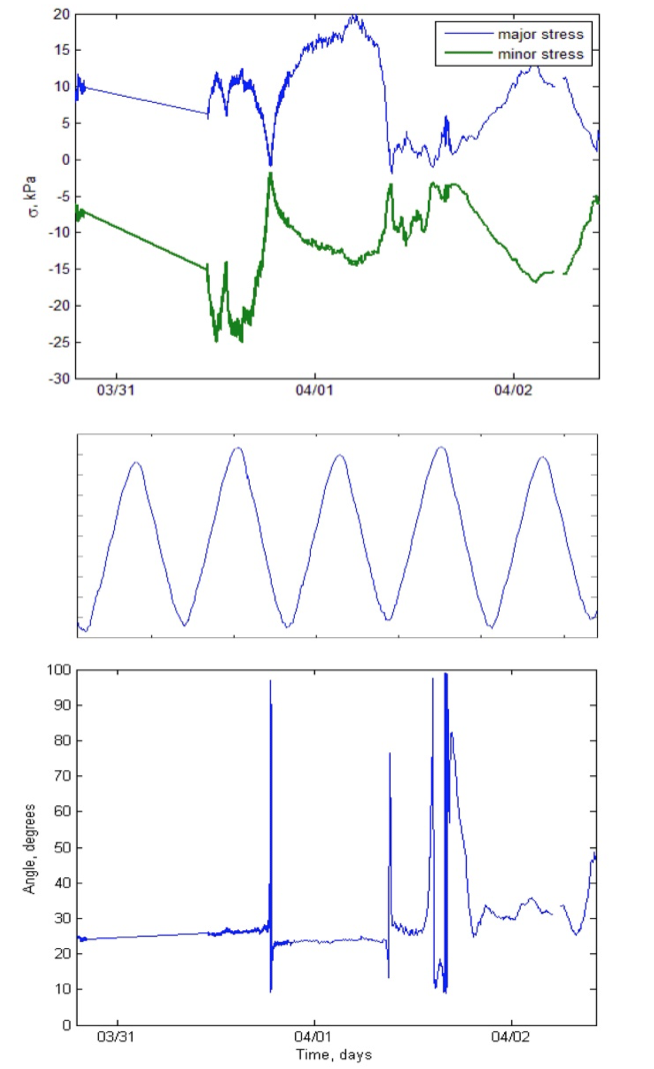
Figure 9. Principal stresses, angle between the major stress and the north direction and corresponding tide (Site 2)
Analysis and Discussion
In Fig. 6 one can see how clearly how the recorded pressure peaks follow the changes in tidal pressure from low to high. Pressure registered on the sensor 4 is much higher than the others; it may be because of its closeness to the ice surface.
In Fig. 8 principal stresses for site 1 are presented, one can see that they are also follow the tidal action. The angle between the major stress and north direction is mainly between 27 and 75 degrees, so the major stress is directed between north-north-west and north-west-west. Exclusion is the ending on March 30'th, when the major stress is directed to the west.
In Fig. 7 and 9 where measurements from the site 2 are presented, there is no visible dependence on the tidal action. It can be because the position is far enough from the coastal line and tide don't influence on stresses in the ice. Sensor 4 still shows much bigger measurements and the reason is the same as at the site 1. The angle between the major stress and north direction is mainly between 20 and 30 degrees. The major stress is directed to the north-north-west.
In all cases the biggest normal stresses shows sensor 1 and sensor 4 that are faced to the shoreline. That means that the main forces in the ice have their directions to and from the coast. This is confirmed by the direction of the major principle stresses.
One can see much higher stresses in site 1 than site 2 (site 1 maximum – 195kPa, site 2 maximum – 27kPa). Also it seems to be no tidal influence on site 2.
Conclusion
In the site 1 stresses in the ice tend to follow the tide. Also they are not really affected by temperature changes, as there are no dramatically drops or rises (Fig. 6). In site 2 the situation is opposite, the only thing that seems to influence on the stresses in the ice is temperature, this effect was discussed [23]. As you can see on the Fig. 7 every 12 hours temperature rises or goes down on 20-25 degrees. It causes variation in ice pressure that looks exactly the same as temperature variations. The sensors, that are the most affective to the pressure changes, are the 1 and the 4 in the both sites. As they are faced to the coastal line a conclusion can be made that the main forces in the ice have their action direction to the shore.
References
[1] Guenette, C.C., Sergy, G.A., Owens, E.H., Prince, R.C., Lee, K. Experimental design of the Svalbard shoreline field trials (2003) Spill Science & Technology Bulletin, Vol. 8, №3, pp. 245¬256.
[2] Sanderson, T. Ice Mechanics - Risks to Offshore Structures (1988) Ice Mechanics - Risks to Offshore Structures, 253 p.
[3] Loset, S., Shkhinek, K.N, Strass, P., Gudmestad, O.T., Michalenko, E.B., & Karna, T. Ice conditions in the Barents and Kara seas (1997) Proceedings of the International Conference of Mechanical Engineering, pp. 173-182.
[4] Sinitsyn, A.O., Shkhinek, K.N, Loset, S. Investigations of mechanical properties of plastic- frozen soils of Arctic coasts (2008) SafeLOT project, 7 p.
[5] Andersland, O.B., Ladanyi B. Frozen Ground Engineering: Second Edition (2004) Frozen Ground Engineering: Second Edition, 367 p.
[6] Loset, S., Shkhinek, K.N, Strass, P., Gudmestad, O.T., Michalenko, E.B., Frederking, R., Karna, T. Comparison of the physical environment of some Arctic seas (1999) Cold regions Science and Technology, 29, pp. 201-214.
[7] Vaughan, D.G. Tidal flexure at ice shelf margins (1995) Journal of Geophysical Research, Vol. 100, №B4, pp. 6213-6224.
[8] Forbes, D.L., Taylor, R.B. Ice in the shore zone and geomorphology of cold coasts (1994) Progresses in Physical Geography, Vol. 18, №1, pp. 59-89.
[9] Caline, F., Barrault, S. Measurements of stresses in the coastal ice on both sides of a tidal crack (2008) Proceedings of the 19th IAHR International Symposium on Ice, pp. 1041-1050.
[10] Liang, L., Shkhinek, K.N. Predelnaya nesushchaya sposobnost ledyanykh balok [Ultimate bearing capacity of ice beams] (2013) Magazine of Civil Engineering, 1(36), pp. 65-74.
[11] Liang, L., Shkhinek, K.N. Vozdeystviye lda na otkosnyye sooruzheniya [Dynamic interaction between ice and inclined structure] (2014) Magazine of Civil Engineering, 1(45), pp. 71-79.
[12] Shkhinek, K.N., Uvarova E., Dynamics of the ice sheet interaction with the sloping structure (2001) Proceedings of International Conference on Port and Ocean Engineering under Arctic Conditions, 2, pp. 639-648.
[13] Instruction Manual. Model LC-2. Single Channel Datalogger (2013) Geocon, Inc., 67 p.
[14] Instruction Manual. Models 4800, 4810, 4815, 4820 and 4830. VW Earth Pressure Cells (2011) Geocon, Inc., 83 p.
[15] Caline, F., Barrault, S. Transmission of level stresses to ice foot through a tidal crack (2008) Proceedings of 19th IAHR International Symposium in Ice, 2, pp. 831-840.
[16] Barrault, S., Hoyland, K.V. Mechanisms and measurements of stresses in first-year land-fast ice (2007) Proceedings of 19th International Conference on Port and Ocean Engineering under Arctic Conditions, 2, pp. 685-694.
[17] Bergdahl, L. Physics of Ice and Snow as Affects Thermal Pressure (1977) Physics of Ice and Snow as Affects Thermal Pressure, 157 p.
[18] Duckworth, R., Westermann, P. Stress and strain instruments developed for field measurement of ice (1989) IEEE Journal of Oceanic Engineering, 14(2), pp. 159-165.
[19] Gabrielsen, M., Barrault, S., Caline, F., Hoyland, K.V. Comparison of physical and mechanical properties of coastal ice and level ice (2008) Proceedings of 19th IAHR International Symposium in Ice, 2, pp. 956-974.
[20] Moslet, P.O., Hoyland, K.V. Ice stress measurements adjacent to a wide structure in land-fast ice (2003) Proceedings of 17th International Conference on Port and Ocean Engineering under Arctic Conditions, 1, pp. 283-292.
[21] Prinsenberg, S., Fowler, G., Baaren, A., Beanlands, B. Ice stress measurements from land-fast ice along Canada's Labrador coast (1997) Cold Regions Science and Technology, 25, pp. 1-15.
[22] Weeks, W. On Sea Ice (2010) On Sea Ice, 664p.
[23] Teigen, S.H., Hoyland, K.V., Moslet, P.O. Thermal stresses in first year sea ice (2005) Proceedings of 18th International Conference on Port and Ocean Engineering under Arctic Conditions, 2, pp. 893-903.
Innovative Technologies in Development of Construction Industry
10.4028/www.scientific.net/AMM.725-726
Coastal Ice Investigation on the Site of Further Bridge Construction - Sveagruva, Svalbard, Norway
10.4028/www.scientific.net/AMM.725-726.235
Keywords: Sea ice, coastal ice, hinge zone, stresses in the ice, tides, tidal cracks, pressure sensors, Arctic, Svalbard.